
Where Computing Students Stall: Our Poster at Evaluation 2026
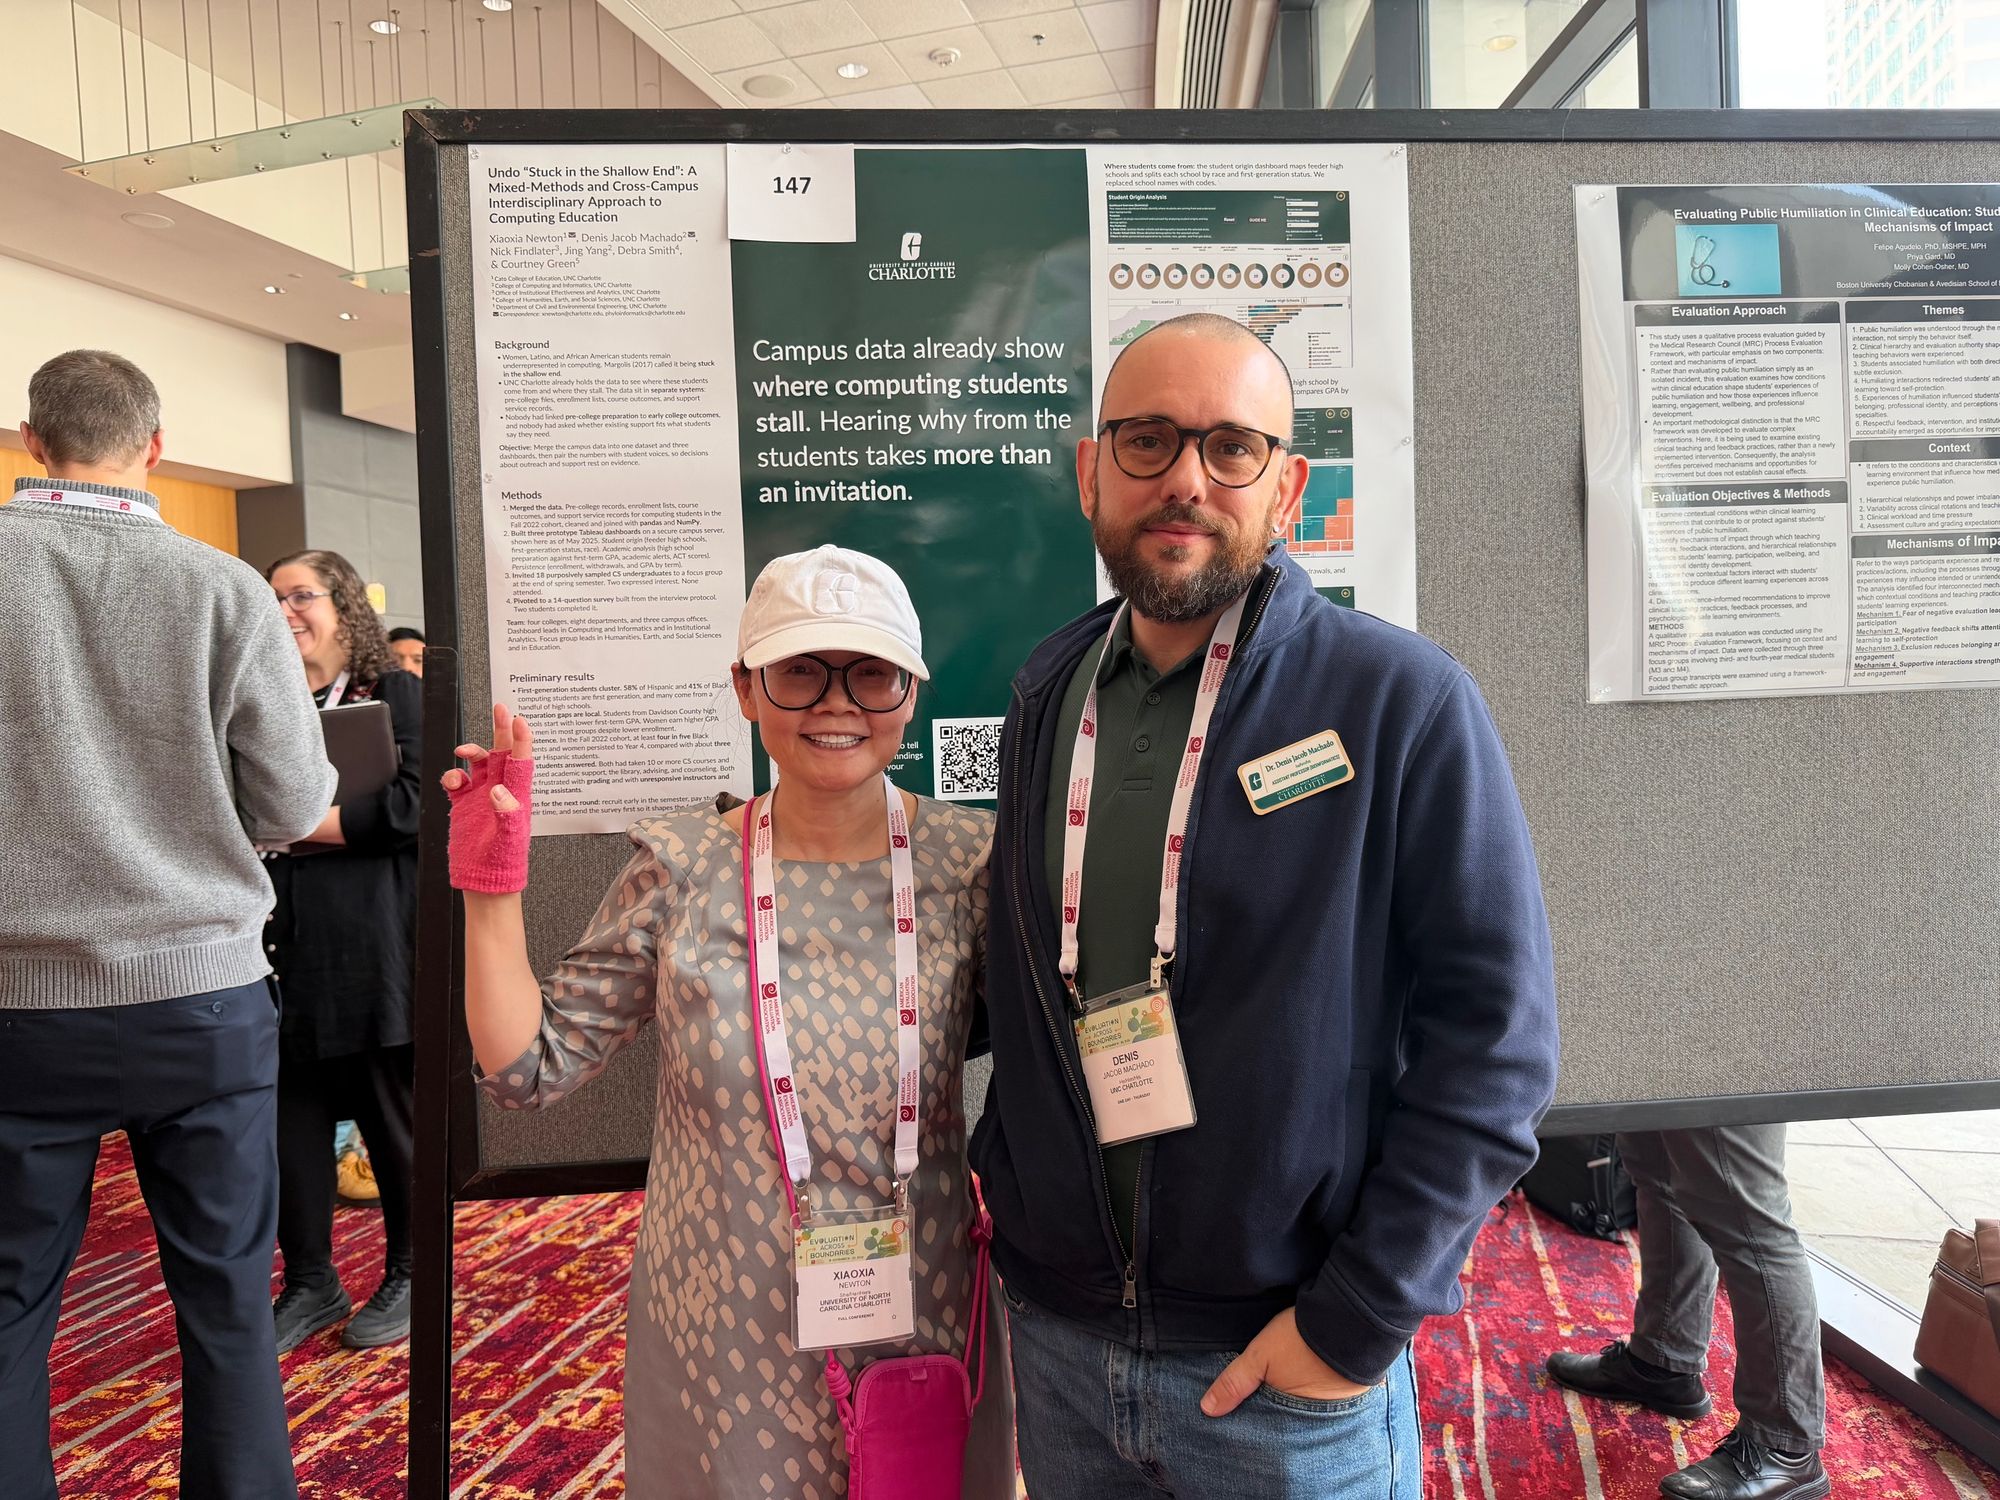
Our poster at Evaluation 2026
On Thursday, November 19, 2026, Xiaoxia Newton and I presented our poster at Evaluation 2026, the annual conference of the American Evaluation Association (AEA). The conference ran from November 16 to 20 at the Charlotte Convention Center in Uptown Charlotte. Our poster was one of 260 on Thursday’s program, in the session on Foundations and Core Practice and Design, Methods, Evidence, and Use.
The poster is titled “Undo “Stuck in the Shallow End”: A Mixed-Methods and Cross-Campus Interdisciplinary Approach to Computing Education”. The authors are Xiaoxia Newton (Cato College of Education), me (College of Computing and Informatics), Nick Findlater (Office of Institutional Effectiveness and Analytics), Jing Yang (College of Computing and Informatics), Debra Smith (College of Humanities, Earth, and Social Sciences), and Courtney Green (Department of Civil and Environmental Engineering). We are all at UNC Charlotte. Xiaoxia presented the qualitative side of the project, and I presented the quantitative side.
The question
Women, Latino, and African American students remain underrepresented in computing. Margolis (2017) called this being stuck in the shallow end, and our title borrows the phrase.
UNC Charlotte already has data on where computing students come from and where they stall. The data sit in separate systems: pre-college files, enrollment lists, course outcomes, and support service records. Nobody had linked pre-college preparation to early college outcomes. Nobody had asked whether existing support fits what students say they need.
A UNC Charlotte Student Success Grant funded a pilot project to close both gaps. Xiaoxia led the project. The team spans four colleges, eight departments, and three campus offices.
What we built
We merged pre-college records, enrollment lists, course outcomes, and support service records for computing students in the Fall 2022 cohort. We cleaned and joined the records with pandas and NumPy. From the merged data, we built three prototype Tableau dashboards on a secure campus server.
The first dashboard shows where students come from. It maps feeder high schools and splits each school by race and first-generation status. The second dashboard shows how students start. It compares high school preparation with first-term GPA, academic alerts, and ACT scores. The third dashboard shows who stays. It tracks enrollment, withdrawals, and GPA by term. The poster shows the dashboards as of May 2025, and we replaced every school name with a code.
What the numbers show
The merged data show that 58% of Hispanic and 41% of Black computing students are first-generation. Many of these first-generation students come from a handful of high schools. Students from Davidson County high schools start with a lower first-term GPA. Women earn higher GPAs than men in most groups. In the Fall 2022 cohort, at least four in five Black students and women persisted to Year 4, compared with about three in four Hispanic students.
Hearing from students took more than an invitation
The numbers show where students stall, but they do not show why. To hear from the students, we invited 18 purposively sampled computer science (CS) undergraduates to a focus group at the end of the spring semester. Two expressed interest. None attended.
Because nobody came, we turned the interview protocol into a 14-question survey. Two students completed it. Both had taken at least 10 CS courses. Both had used academic support, the library, advising, and counseling. Both were frustrated with grading and with unresponsive instructors and teaching assistants.
For the next round, we would recruit early in the semester, pay students for their time, and send the survey first so it shapes the focus group.
The poster
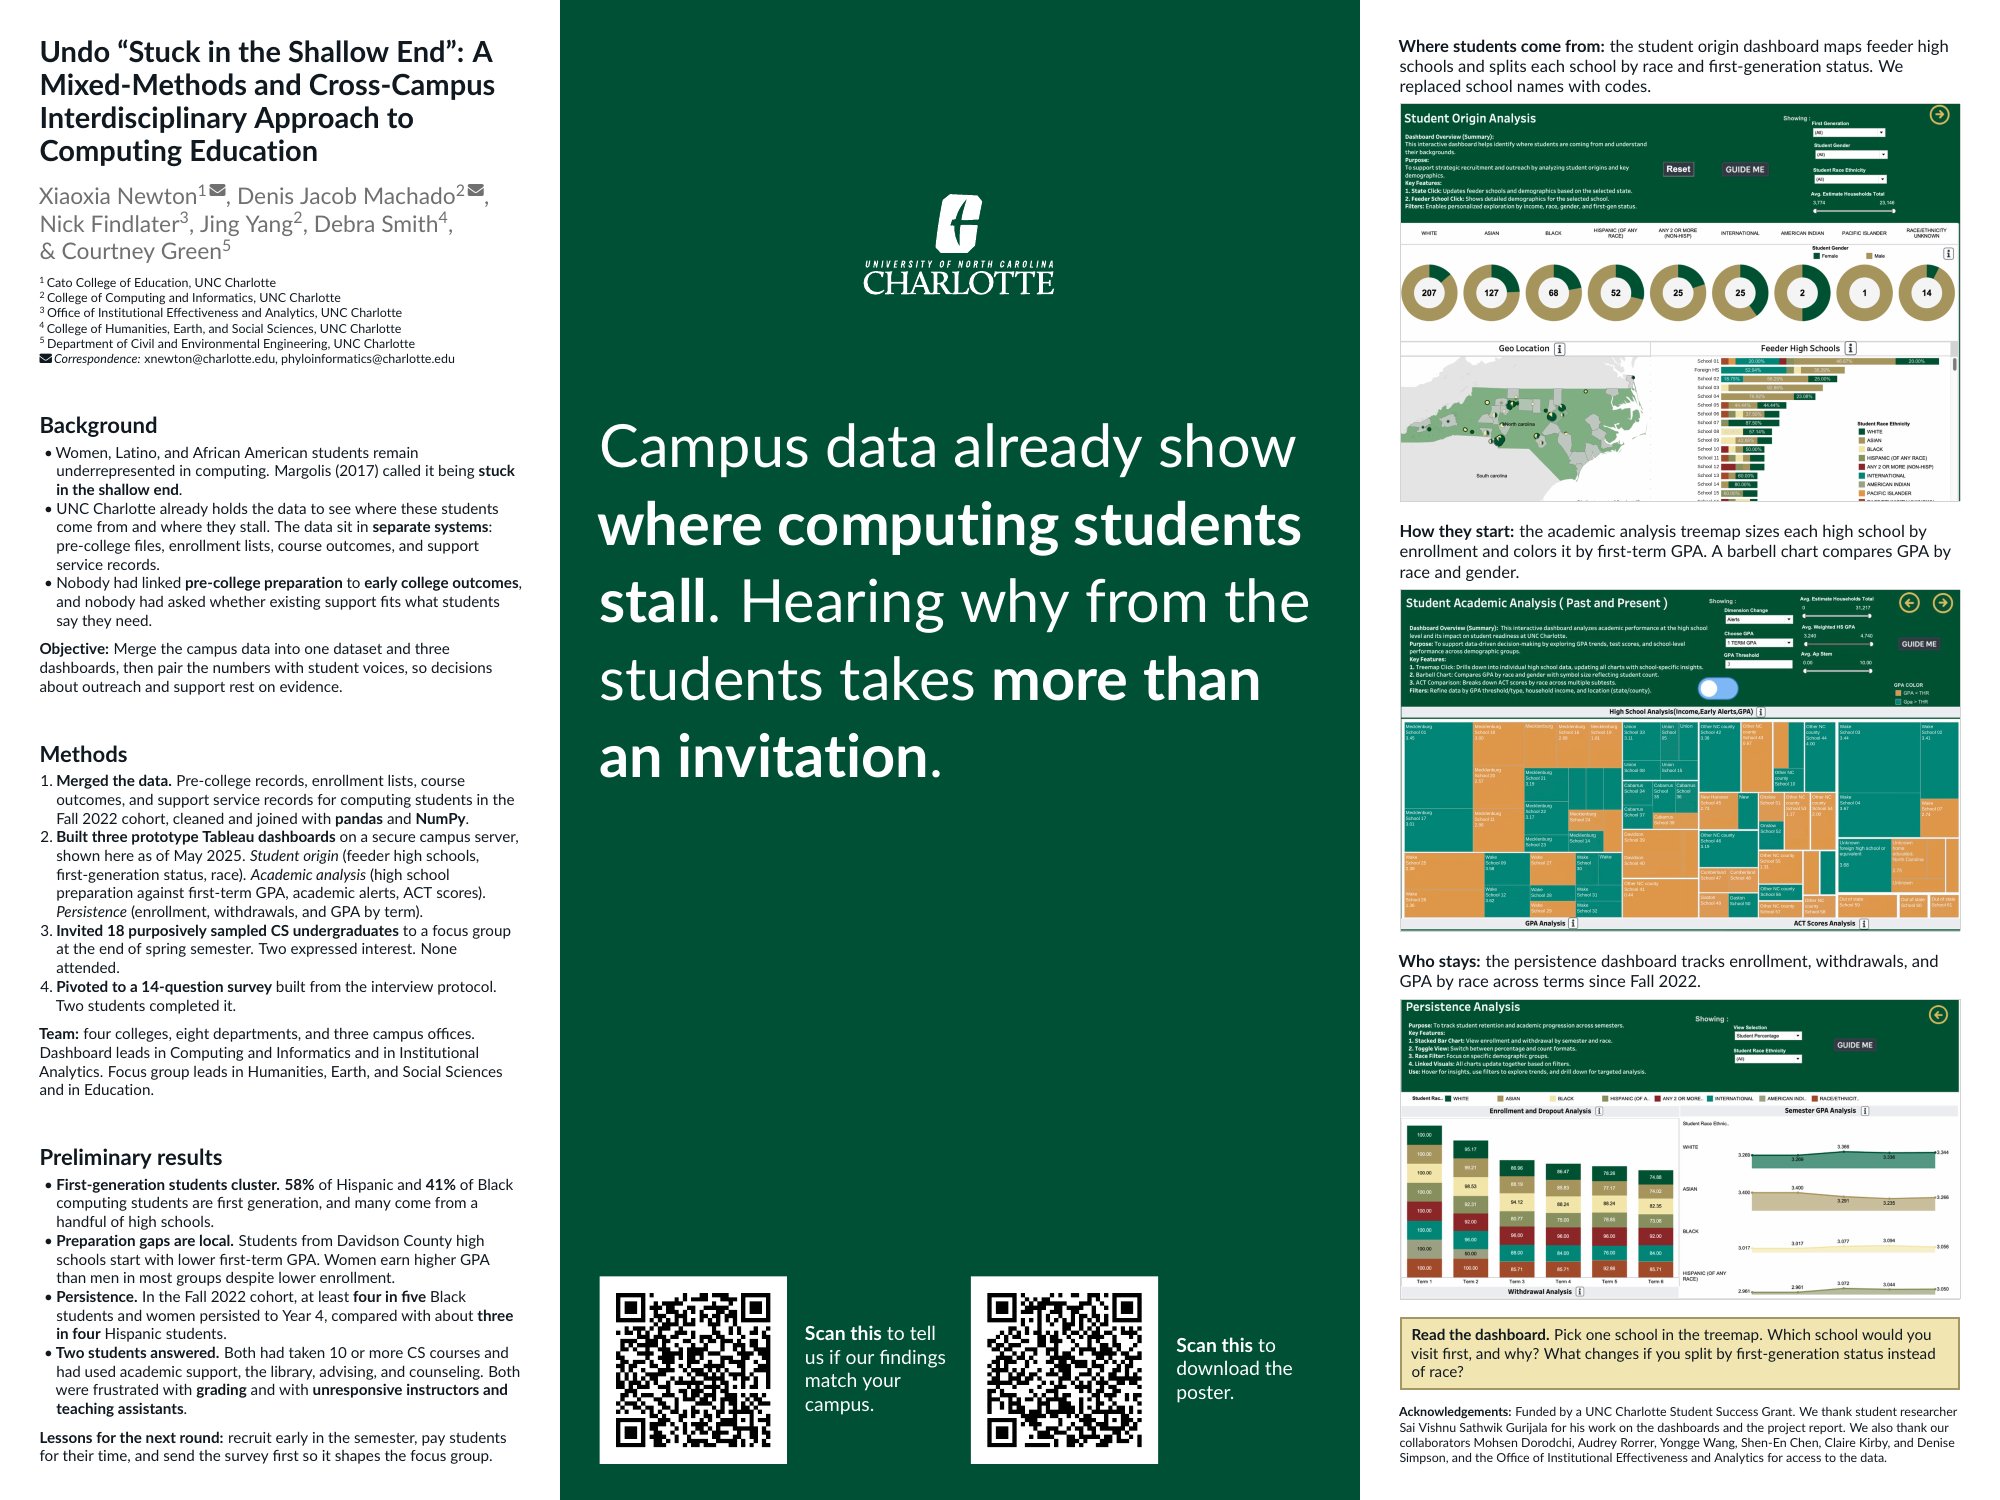
The poster asks visitors to read the dashboards. Pick one school in the treemap. Which school would you visit first, and why? What changes if you split by first-generation status instead of race? One QR code on the poster opens a short form that asks whether our findings match your campus. If you work in computing education or institutional research, you can still tell us whether our findings match your campus.
How to cite this poster
Newton, X., Jacob Machado, D., Findlater, N., Yang, J., Smith, D., and Green, C. 2026. Undo “Stuck in the Shallow End”: A Mixed-Methods and Cross-Campus Interdisciplinary Approach to Computing Education. Poster, Evaluation 2026, American Evaluation Association, Charlotte, NC, USA. Zenodo. https://doi.org/10.5281/zenodo.22754043
This DOI always points to the latest version of the record. The poster and the abstract carry a Creative Commons Attribution-NonCommercial-ShareAlike 4.0 license.
Thank you
Thank you to Xiaoxia for leading the project and for presenting with me. Thank you to Nick for the institutional data and the newest numbers, and to Jing for coding the school names on the dashboards. Thank you to Debra and Courtney for their work on the team. We also thank student researcher Sai Vishnu Sathwik Gurijala for work on the dashboards and the project report. Thank you to our collaborators Mohsen Dorodchi, Audrey Rorrer, Yongge Wang, Shen-En Chen, Claire Kirby, and Denise Simpson, and to the Office of Institutional Effectiveness and Analytics for access to the data. Finally, thank you to the College of Computing and Informatics for printing the poster, and to AEA for bringing Evaluation 2026 to Charlotte.
Previous post
Is a Graduate Degree in Bioinformatics Still Worth It?